
Build reports for Power BI
Rich data transformation and visual analytics experiences help you build reports for Power BI.
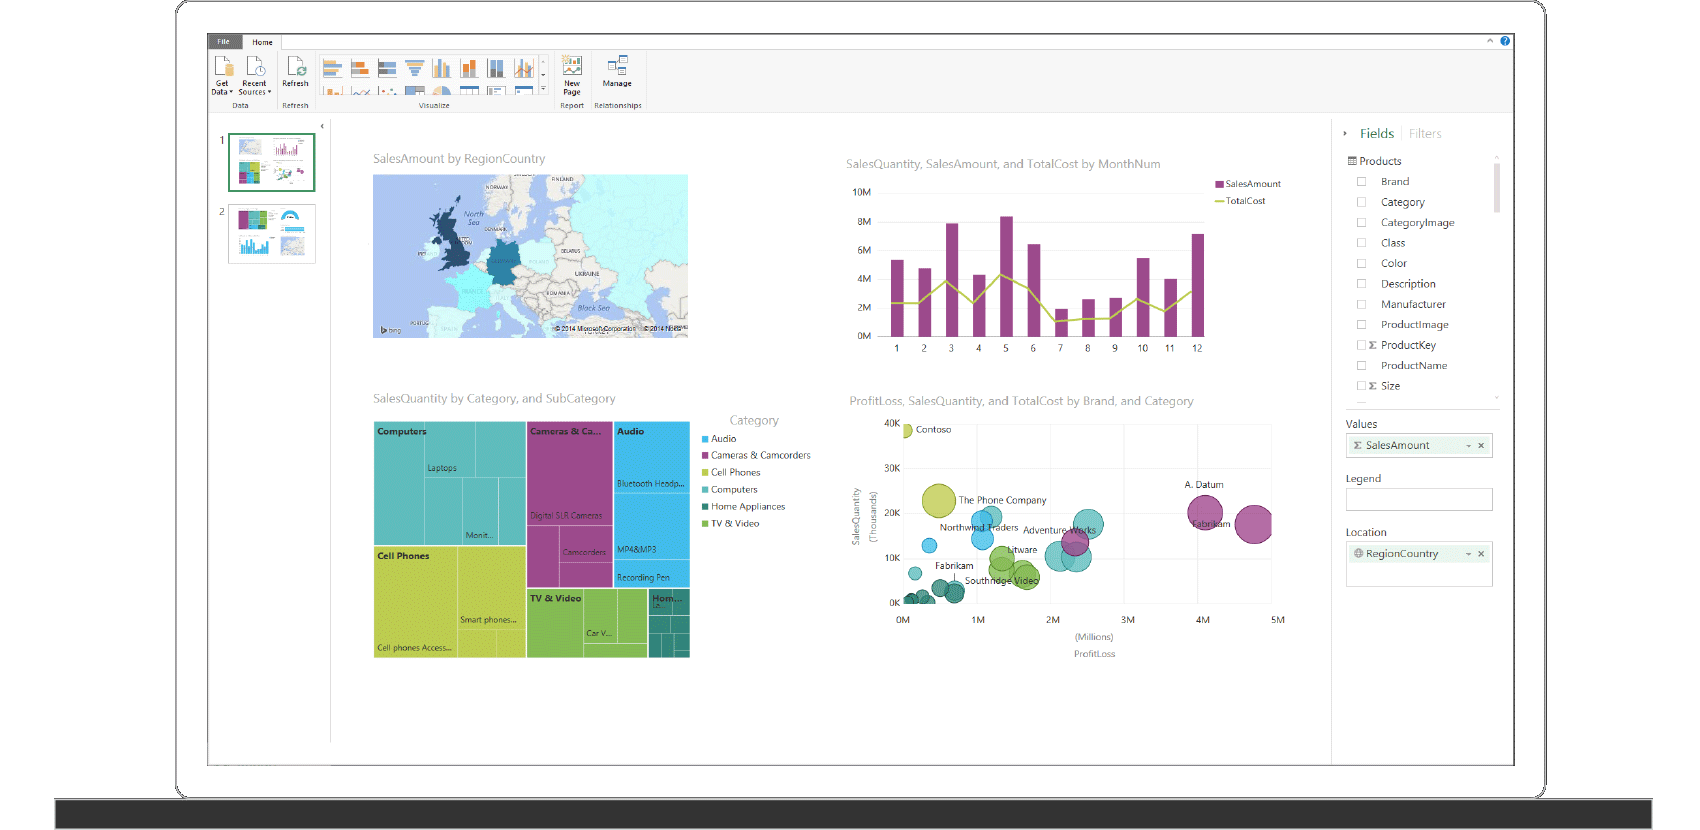
Power BI Designer is a dedicated report authoring tool for the Power BI Preview service. The Power BI Designer provides rich data transformation and visual analytics in a unified, seamless experience. The Power BI Designer enables you to create impactful reports with state-of-the-art interactive charts, maps, graphs, and data transformations. Upload your reports to the Power BI preview and empower others with timely critical insights on any device, anywhere.
Future of Power BI
Connect to all your data
Excel spreadsheets, on-premises data sources, Hadoop datasets, streaming data, and cloud services — Power BI brings all your data together so you can start analyzing it in seconds.

Your data made beautiful
Power BI puts visual analytics at your fingertips with intuitive report authoring. Drag and drop to place content exactly where you want it on the flexible and fluid Designer canvas. Quickly discover patterns as you explore a single, unified view of linked, interactive visualizations.
 |
 |
 |
||
Transform and clean dataGetting your data ready to analyze is hard. We're on a mission to make it much easier. Try the data shaping and modeling capabilities of Power BI and take back hours in your busy day. |
Complete analytics life-cycleThe Power BI Designer is an elegant end-to-end solution for building analytics for the Power BI preview. The Designer has all the capabilities to quickly connect, shape, visualize, and share data insights through Power BI. |
Design once, view anywhereWe know you need to get data into the hands of decision makers when and where they need it. Power BI makes publishing and sharing your beautiful interactive reports easy. |
Experience what's next in Power BI
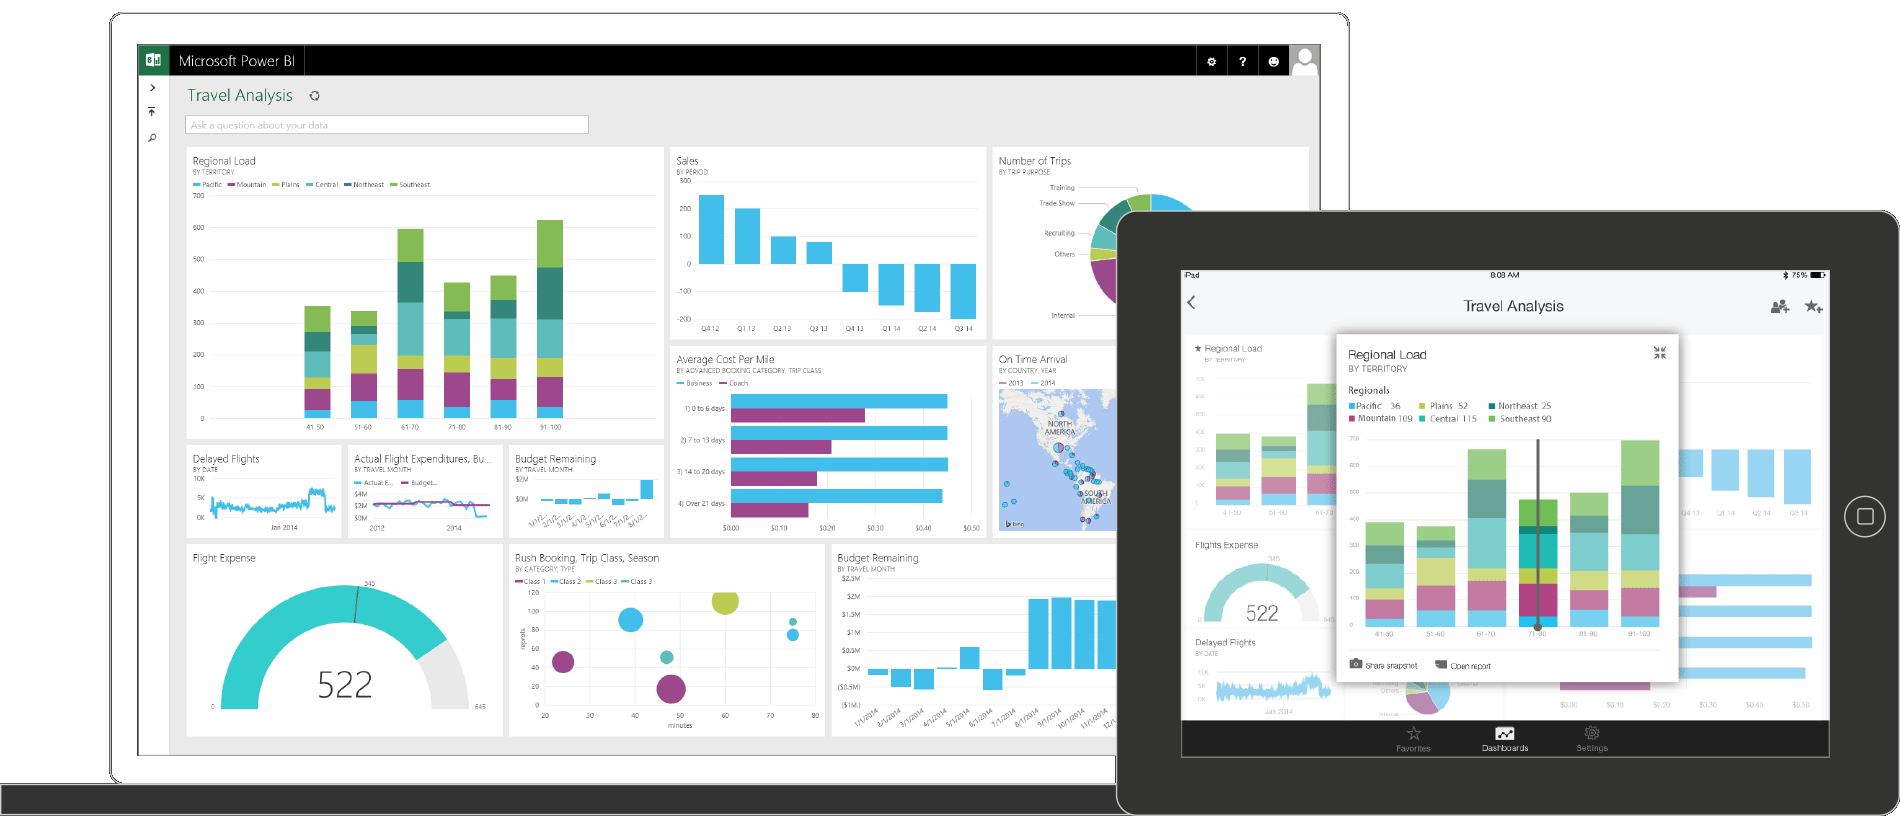
Monitor the pulse of your business, on all your devices, at any time.
Dashboarding made simple
From zero to insightCreate personalized dashboards and reports on your data in less |
 |
 |
Explore and discover answersFind answers to your most important questions using natural language and drag and drop gestures. |
Monitor the health of your companyMake decisions based on the right data anytime, anywhere, on any |
 |
 |
Build interactive reportsCreate stunning reports in Excel 2013 or the Power BI Designer. |
Connect to all your data
 Dynamics CRM |
 Salesforce |
 SendGrid |
 Excel |
 Zendesk |
 Github |
 Marketo |
 Active Directory |
 SQL Server Analysis Services |
 Azure SQL |
 Exchange |
 HDInsight |
 HDFS |
 IBM DB2 |
 MySQL |
 OData |
 Oracle |
 PostgreSQL |
 SharePoint |
 Access |


